
Page 229 - 北京京煤集团总医院第十届·2022学术年会论文集
P. 229
北京京煤集团总医院 第十届·2022 学术年会论文集
GSE147507 dataset. B: Volcano plot of DEGs in GSE143303 dataset. The red dots represent
upregulated genes, and the green dots represent downregulated genes. C: Venn diagram of DEGs in
GSE147507 and GSE143303 datasets.
3.2. Enrichment analysis of DEGs
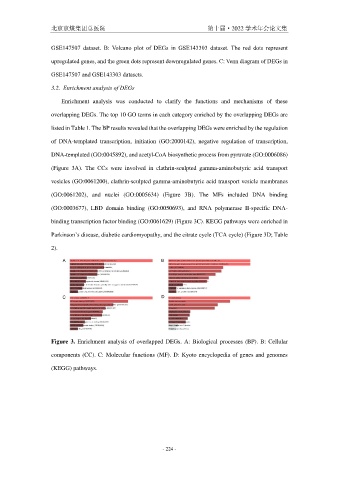
Enrichment analysis was conducted to clarify the functions and mechanisms of these
overlapping DEGs. The top 10 GO terms in each category enriched by the overlapping DEGs are
listed in Table 1. The BP results revealed that the overlapping DEGs were enriched by the regulation
of DNA-templated transcription, initiation (GO:2000142), negative regulation of transcription,
DNA-templated (GO:0045892), and acetyl-CoA biosynthetic process from pyruvate (GO:0006086)
(Figure 3A). The CCs were involved in clathrin-sculpted gamma-aminobutyric acid transport
vesicles (GO:0061200), clathrin-sculpted gamma-aminobutyric acid transport vesicle membranes
(GO:0061202), and nuclei (GO:0005634) (Figure 3B). The MFs included DNA binding
(GO:0003677), LBD domain binding (GO:0050693), and RNA polymerase II-specific DNA-
binding transcription factor binding (GO:0061629) (Figure 3C). KEGG pathways were enriched in
Parkinson’s disease, diabetic cardiomyopathy, and the citrate cycle (TCA cycle) (Figure 3D; Table
2).
Figure 3. Enrichment analysis of overlapped DEGs. A: Biological processes (BP). B: Cellular
components (CC). C: Molecular functions (MF). D: Kyoto encyclopedia of genes and genomes
(KEGG) pathways.
- 224 -