
Page 228 - 北京京煤集团总医院第十届·2022学术年会论文集
P. 228
北京京煤集团总医院 第十届·2022 学术年会论文集
pathway enrichment analyses with a cutoff of P < 0.05. The GO functional analyses included BP,
CC, and MF.
2.4. PPI network
The PPI network was built using the STRING database (17) with a threshold of confidence
score > 0.4 to analyze the protein–protein interactions between the overlapped DEGs, and the PPI
network was shown by Cytoscape [18]. In addition, based on the maximal clique centrality
algorithm in the Cytohubba plug-in of Cytoscape [18], hub genes were identified from the PPI
network.
2.5. Identification of transcription factor (TF)-gene, miRNAs-gene interaction
The NetworkAnalyst website [19] was used to analyze the TFs and miRNAs of the overlapped
DEGs, and the TF-gene and miRNA-gene interaction networks were built.
2.6. Drug–gene interaction and related diseases
The overlapped DEGs also served as promising targets for searching drugs through the
DSigDB database [20] with an adjusted cutoff value, P < 0.05. In addition, the overlapping DEGs
were input into the DisGeNET database [21] to investigate the diseases associated with overlapping
DEGs.
3. Results
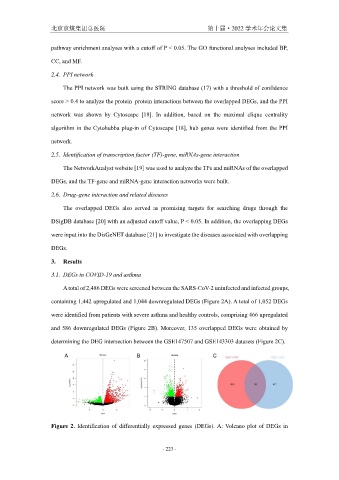
3.1. DEGs in COVID-19 and asthma
A total of 2,486 DEGs were screened between the SARS-CoV-2 uninfected and infected groups,
containing 1,442 upregulated and 1,044 downregulated DEGs (Figure 2A). A total of 1,052 DEGs
were identified from patients with severe asthma and healthy controls, comprising 466 upregulated
and 586 downregulated DEGs (Figure 2B). Moreover, 135 overlapped DEGs were obtained by
determining the DEG intersection between the GSE147507 and GSE143303 datasets (Figure 2C).
Figure 2. Identification of differentially expressed genes (DEGs). A: Volcano plot of DEGs in
- 223 -