Page 11 - 北京京煤集团总医院第十届·2022学术年会论文集
        P. 11
     北京京煤集团总医院                                              第十届·2022 学术年会论文集
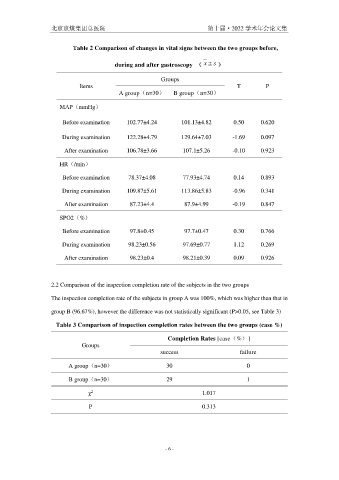
                           Table 2 Comparison of changes in vital signs between the two groups before,
                                         during and after gastroscopy  (  x   s  )
                                                          Groups
                             Items                                                  T         P
                                           A group(n=30)      B group(n=30)
                      MAP(mmHg)
                       Before examination     102.77±4.24         101.13±4.82      0.50      0.620
                       During examination     122.28±4.79        129.64±7.03       -1.69     0.097
                        After examination     106.78±3.66        107.1±5.26        -0.10     0.923
                      HR(/min)
                       Before examination     78.37±4.08         77.93±4.74        0.14      0.893
                       During examination     109.87±5.61        113.86±5.83       -0.96     0.341
                        After examination      87.23±4.4          87.9±4.99        -0.19     0.847
                      SPO2(%)
                       Before examination      97.8±0.45          97.7±0.47        0.30      0.766
                       During examination     98.23±0.56         97.69±0.77        1.12      0.269
                        After examination      98.23±0.4         98.21±0.39        0.09      0.926
                   2.2 Comparison of the inspection completion rate of the subjects in the two groups
                   The inspection completion rate of the subjects in group A was 100%, which was higher than that in
                   group B (96.67%), however the difference was not statistically significant (P>0.05, see Table 3)
                     Table 3 Comparison of inspection completion rates between the two groups (case %)
                                                            Completion Rates [case(%)]
                              Groups
                                                         success                     failure
                         A group(n=30)                     30                           0
                         B group(n=30)                     29                           1
                                 2
                                χ                                       1.017
                                P                                       0.313
                                                           - 6 -
     	
